MDOT Sponsors Walking Audit of Washtenaw Avenue

On April 22, elected officials, planners and engineers assembled to perform an MDOT sponsored walking audit of Washtenaw Avenue in Pittsfield and Ypsilanti Townships.  Walkability audits are designed to help community officials and other stakeholders realize the benefits of providing a safe and attractive environment for walking.

MDOT’s audit team included renowned experts Peter Lagerway and Hannah Remtema.

The audit team faced a number of issues challenging pedestrians such as incomplete sidewalks, narrow separation from vehicles and a lack of safe crossing opportunities.  The results of the audit will help the Reimagine Washtenaw team as the project moves towards implementation.  In 2015 Community Development Block Grant funds will be used to fill in some of the sidewalk gaps that exist along the corridor.

Walking Audit Team


MLive Covers Upcoming ArborBike Bike Share

Map of stations around Downtown Ann Arbor and the University of Michigan Campus

A recent article on MLive's The Ann Arbor News covers the new Bike Share, ArborBike, from the Clean Energy Coalition.  The Bike Share is a joint partnership between the Clean Energy Coalition, University of Michigan, and the City of Ann Arbor.  Phase 1 of the program will include 125 bicycles at 14 stations in various locations around Downtown Ann Arbor and the University of Michigan.  According to MLive, the stations will begin rolling out in June of this year, and annual memberships will be $65.  Fore more information, check out the article on MLive.

SSTI: Travel Demand Estimates Overshooting Reality

In a recent post from the State Smart Transportation Initiative, a group that promotes environmental sustainability and economic equity within transportation policy, says USDOT continues to overestimate the amount of demand on the transportation infrastructure in its most recent Conditions and Performance report.  

The chart from SSTI below, shows the trends identified in previous C&P reports, including the 2013(trend) line, which is new to this report.  The solid lines estimate growth at approximately 1.86%, and are based off of FHWA's HPMS program.  The new line is based off of observed trends rather than HPMS program, and shows growth at 1.36%.

However as SSTI's Eric Sundquist writes:

The three years since 2010 have all seen much lower growth than either estimate would suggest, -0.7 percent, 0.3 percent, and 0.6 percent respectively. So by 2013, the year the new report is dated, the new C&P was already estimating VMT that was 5 to 6 percent higher than actual, depending on which of the assumptions is used.

Both the C&P report and the SSTI illustrate the complex nature of projecting travel demand and the assumptions used in models.  Traditional transportation model were designed to assess the utility and need for highway and roadway expansion.  However, changing preferences, tight budgets, and technology are changing the demands on the system in ways these models cannot account for.  

Fortunately, any slowing in VMT growth allows local and state agencies to focus on pavement preservation rather than capacity expansion.  For more information, check out

Original post from SSTI

FHWA's Conditions and Performance Report

Record 10.7 Billion Trips Taken On U.S. Public Transportation In 2013

Covered Stop AATA Source Ann Arbor City.jpg

Press Release from the American Public Transit Association

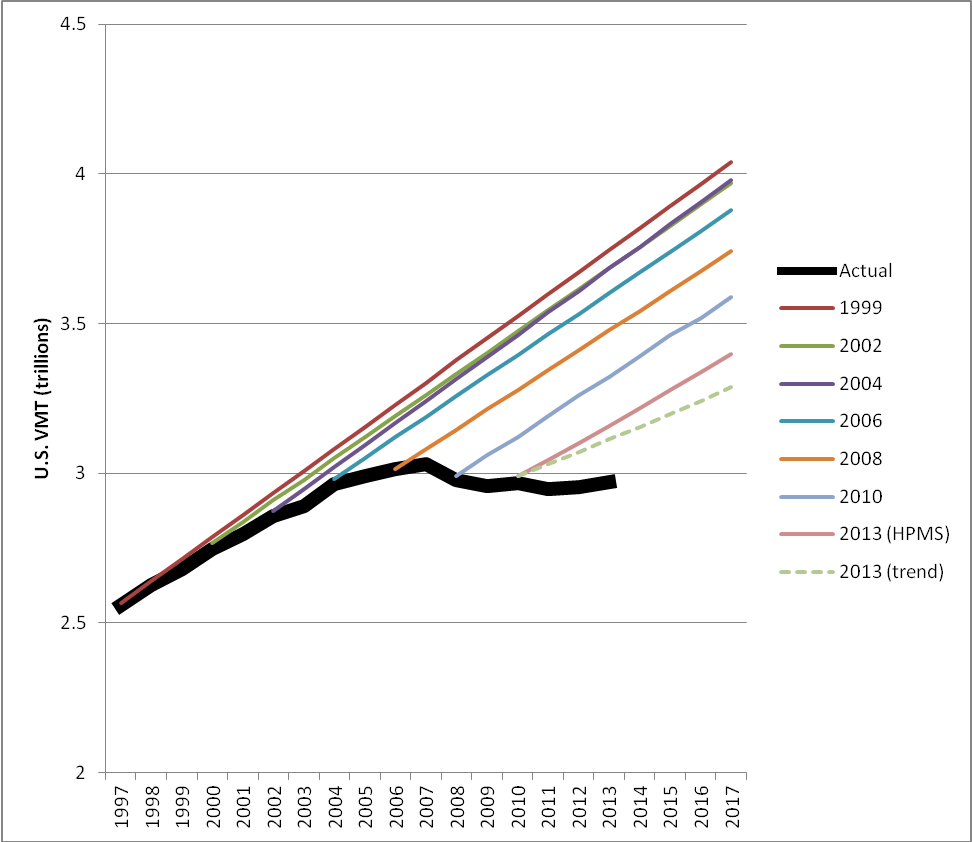
In 2013 Americans took 10.7 billion trips on public transportation, which is the highest annual public transit ridership number in 57 years, according to a report released today by the American Public Transportation Association (APTA). This was the eighth year in a row that more than 10 billion trips were taken on public transportation systems nationwide.  While vehicle miles traveled on roads (VMT) went up 0.3 percent, public transportation use in 2013 increased by 1.1 percent.

“Last year people took 10.7 billion trips on public transportation.  As the highest annual ridership number since 1956, Americans in growing numbers want to have more public transit services in their communities,” said Peter Varga, APTA Chair and CEO of The Rapid in Grand Rapids, MI.  “Public transportation systems nationwide – in small, medium, and large communities – saw ridership increases. Some reported all-time high ridership numbers.”

Some of the public transit agencies reporting record ridership system-wide or on specific lines were located in the following cities:  Ann Arbor, MI; Cleveland, OH; Denver, CO; Espanola, NM; Flagstaff, AZ; Fort Myers, FL; Indianapolis, IN; Los Angeles, CA; New Orleans, LA; Oakland, CA; Pompano Beach, FL; Riverside, CA; Salt Lake City, UT; San Carlos, CA; Tampa, FL; Yuma, AZ; and  New York, NY.

Since 1995 public transit ridership is up 37.2 percent, outpacing population growth, which is up 20.3 percent, and vehicle miles traveled (VMT), which is up 22.7 percent.

“There is a fundamental shift going on in the way we move about our communities.  People in record numbers are demanding more public transit services and communities are benefiting with strong economic growth,” said APTA President and CEO Michael Melaniphy.

“Access to public transportation matters,” continued Melaniphy. “Community leaders know that public transportation investment drives community growth and economic revitalization.”

Another reason behind the ridership increases is the economic recovery in certain areas.
When more people are employed, public transportation ridership increases since nearly 60 percent of the trips taken on public transportation are for work commutes.”

“The federal investment in public transit is paying off and that is why Congress needs to act this year to pass a new transportation bill,” said Melaniphy.

Click this link to see the complete APTA 2013 ridership report.


What Can Winter Teach Us About Building Better Cities? A Lot

72440028_sneckdown_anntd2.jpg

If you haven't heard of a sneckdown yet, prepare to look at piles of snow and slush in a new way.  It's a combination of the terms snow, and neckdown (a neckdown is a term for pedestrian curb extensions).  Snow acts like tracing paper on the roadways, showing the amount of space cars need to take a safe turn at winter speeds.  Snow melts where vehicles make their turns, and the leftover snow provides visual indicators for potential curb extensions and pedestrian islands.  View some of the pictures above and below to learn more about sneckdowns, or see some of our favorite posts about sneckdowns at Streetsblog or This Old City.

Photo Credit: Clarence Eckerson Jr.

Photo Credit: Clarence Eckerson Jr.

Photo Credit: This Old City

Photo Credit: This Old City