Data Driving Equity - WATS and the Opportunity Index
/Washtenaw County Office of Community and Economic Development (OCED) has released the new 2020 Opportunity Index. This new tool builds off the original 2015 index, and uses key indicators across five categories (health, job access, economic well-being, education and training, and community engagement and stability) to measure how your access to opportunity is impacted by where you live in Washtenaw County.
WATS and the Opportunity Index
Our committee members are very focused on investing in communities that have traditionally been underserved by transportation policies, and this data has been a great tool to help inform policy decisions. Since the development of the 2045 Long Range Plan, WATS has been using the index to measure and track transportation investment in areas of low and very low access to opportunity.
WATS Equity Goal
Our 2045 Long Range Plan includes Equity as one of seven goals and states that it should be a determining factor in selecting projects. Our plan also states a goal of increasing the percent of funding that’s going into equity areas. So how does this play out in practice? One way is to give equity areas a higher priority on applications for projects that are submitted to the Transportation Improvement Program (TIP). We also determine a baseline level of investment going into these areas and then track those investments over time to ensure it’s increasing. These data driven processes are a really good start, but in practice they are not as straightforward. The idea is that if all else is equal that a project in an equity area would get preference, but there are a lot of things that complicate that such as size, scope, and timing of project, or even defining who really benefits from that project. For example, if you have a highway improvement that runs through an equity focus area, some people might say it’s a positive improvement, some people might say it’s a negative change. What about an improvement on a corridor that provides connection between an equity area and a job center? We want to make sure that we can prioritize those projects as well. These are all questions that we’re working through as staff and with our committee members, but the hope is to do our best to move the needle in the right direction.
Measuring and Tracking Investment
We have two different methods for identifying equity areas. One method is to use federally defined Environmental Justice areas, which focuses on areas with high percentages of low income and minority populations. A separate evaluation is also done with the County’s Opportunity Index, where we analyze investment in areas with an overall score on the Index as “low” or “very low”. The EJ analysis is required for our agency, but we wanted to take it a step further, and add an evaluation of the Opportunity Index because of the additional indicators used in this tool, like health and job access. These additional indicators have helped us better understand the structural disparities within our communities, and taking advantage of a tool like the Opportunity Index can really help drive transportation investment in the county.
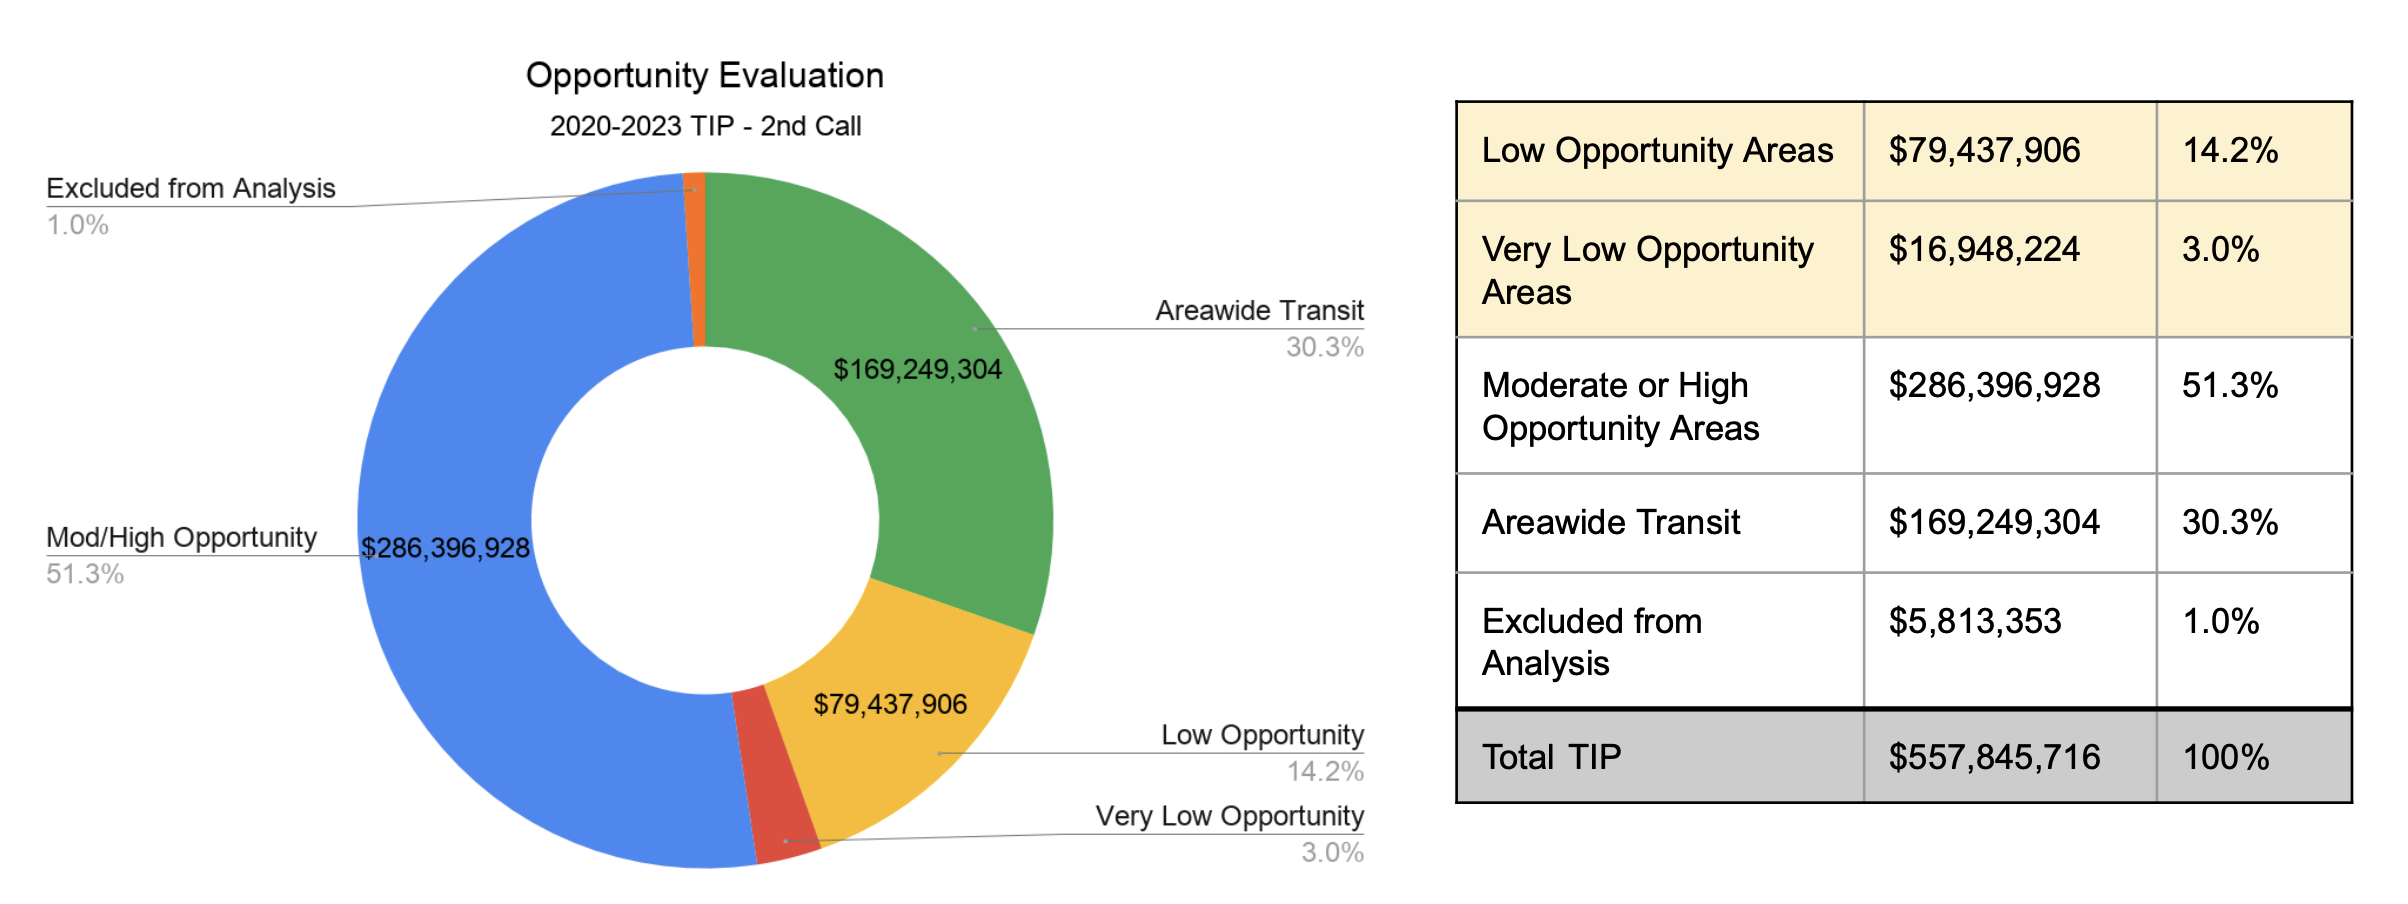
Using the identified equity areas, and the TIP listing of projects, we run a GIS overlay analysis to calculate the portion of all project costs that fall within the equity areas. We provide this analysis to our committee members three times a year, when TIP amendments (major changes to project costs, scope, etc.) go before the Committees for approval. By tracking these investments, our committee members have an opportunity to formally evaluate if enough is being done in equity focus areas. At the last TIP amendment, we had $96 million being invested in low and very low opportunity areas, and that represented about 17.2% of the total TIP value. Over the course of the current TIP, investment has approximately doubled from $51 million to $96 million and as a percent of the total TIP value has increased from 13% to 17%.

Next Steps
The new 2020 index comes at a very timely manner. As we begin the process of developing the 2023-2026 TIP, we will be including the new index in our application for projects. So if a transportation project does fall within a low or very low opportunity area, it will likely have a higher probability of securing funding.
In April, the Board of Commissions unanimously approved a resolution that mandates the Board to utilize the Opportunity Index as part of their review process for new policies. So moving forward, expect to see the Opportunity Index incorporated in policy decisions around Washtenaw County more and more.
The 2020 Opportunity Index can be accessed here.
To learn more about the link between transportation and economic development, click here.


