Greenhouse Gas and VMT Mapped for Entire US
/The CoolClimate Network at UC Berkely recently published some interesting maps that highlight Greenhouse Gas Emissions and Vehicle Miles Traveled for all US zipcodes. The team behind the study wanted to find out which municipalities and locations within the United States contribute the most to household greenhouse gas emissions, and what is the effect of population density and suburbanization on emissions?
The models they developed, based off national household surveys, consistently found lower Household Carbon Footprint (HCF) in urban core areas and higher in outlying suburbs. However, the relationship between population density and HCF was weak until reaching a certain density threshold. The team concluded:
"Differences in the size, composition, and location of household carbon footprints suggest the need for tailoring of greenhouse gas mitigation efforts to different populations."
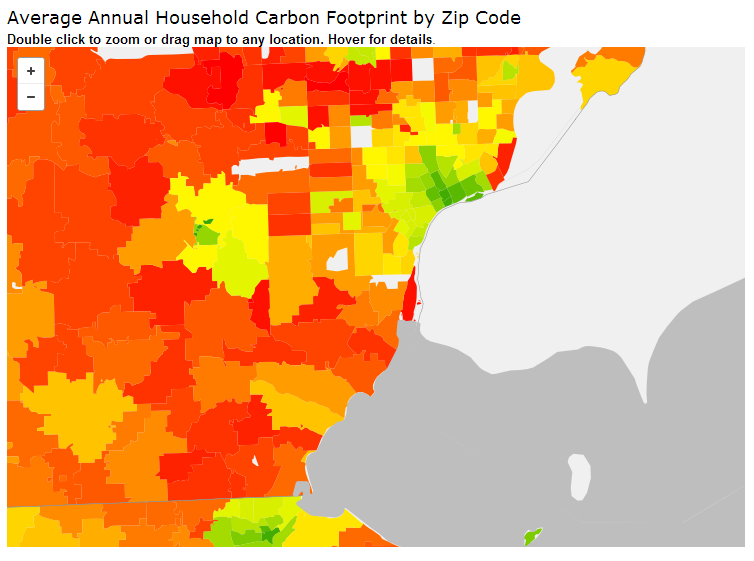
Below, we've included some screenshots from Washtenaw County. For more information, view the maps at the CoolClimate Network website.