
Aerial Video of Alabama Snowstorm
/This is a video taken by drone in Alabama after the South's early 2014 snowstorm. At about 2:48 in the video, you can see people around a bonfire trying to keep warm, alongside the highway...
Be thankful for your winter driving skills and experience. View the video below or visit this link.
Fun Dialect Quiz/Map from New York Times
/The New York Times recently put together a quiz from national survey data about regional dialect. The quiz asks questions about word use and pronunciation, and can map what areas you speak most and least like. Below, you can see the map from WATS Staffer Eric Bombery, who (we really don't need the map for this) is obviously from the Grand Rapids area.
Some sample questions from the quiz include:
- How would you address a group of two or more people?
- What do you call the thing from which you might drink water in a school?
- Do you call the sweet spread that is put on a cake frosting or icing?

WATS' Winter 2014 Newsletter is Available
/The Winter 2014 edition of The Vehicle is available. Click this link to view or download.
This winter, the newsletter discusses:
- The New WATS Website
- TheRide's 5 Year Transportation Improvement Program
- Transportation Forum wrap-up
- Ann Arbor Connector Update
- MDOT's US-23 Project
- FY 2013 Federally Obligated Project Report

Greenhouse Gas and VMT Mapped for Entire US
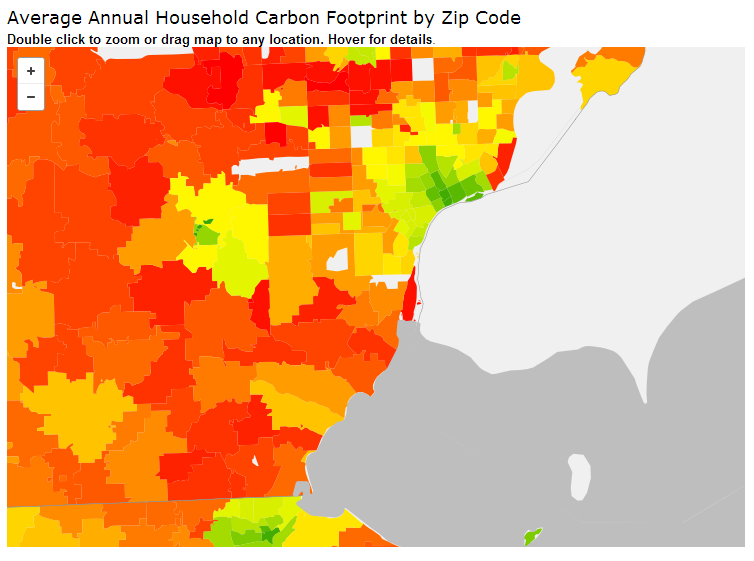
/The CoolClimate Network at UC Berkely recently published some interesting maps that highlight Greenhouse Gas Emissions and Vehicle Miles Traveled for all US zipcodes. The team behind the study wanted to find out which municipalities and locations within the United States contribute the most to household greenhouse gas emissions, and what is the effect of population density and suburbanization on emissions?
The models they developed, based off national household surveys, consistently found lower Household Carbon Footprint (HCF) in urban core areas and higher in outlying suburbs. However, the relationship between population density and HCF was weak until reaching a certain density threshold. The team concluded:
"Differences in the size, composition, and location of household carbon footprints suggest the need for tailoring of greenhouse gas mitigation efforts to different populations."
Below, we've included some screenshots from Washtenaw County. For more information, view the maps at the CoolClimate Network website.

MDOT Economic Impact of Bicycling Study
/
Student Bike Shop in Ann Arbor, Photo Credit: Andy Piper on Flickr
The Michigan Department of Transportation (MDOT) is conducting a study assessing the economic impacts of transportation choices throughout the state. Along with a study team consisting of BBC Research & Consulting and Rory Neuner Consulting, MDOT is interested in learning more about the transportation choices and related spending habits of Michigan residents. MDOT would appreciate your feedback and involvement. Click this link or the title of this post to view and take the survey.
Very Cool Map Projection Website
/London based data-visualization consultant Jason Davies put together an impressive site that animates many common and uncommon map projections. For those uninitiated to map geekery, projections attempt to solve the flattening an orange peel issue, representing a 3 dimensional object on a 2 dimensional surface. Flattening the earth results in portions of it skewing. Projections account for the skew in different ways, sacrificing size, shape, and layout in various combinations to represent certain aspects of the globe. The beauty of Davies' animations is that they make the skew of the earth obvious as the globe rotates. See some of our favorite projections below!
Visit the Map Projection Transitions website to see the animations and explore other projections!


Mythbusters on Roundabouts
/Mythbusters, a favorite show of at least one WATS staffer, recently asked if roundabouts are as fast and safe as traffic engineers and planners claim. Watch the video above to see the results!
Obligated Projects List is Available→
/Every year, WATS publishes a list of all the completed transportation projects in Washtenaw County, the Obligated Projects list. The FY 2013 obligated projects list is available, and can be accessed at this link.
In FY 2013, $46.2 million was obligated in Washtenaw County for highway, local road, bicycle and pedestrian facilities, public transit and safety projects. Of this amount, $12.2 million were Surface Transportation Program funds, which account for $9.4 million for urban programs, $1.7 million for rural programs, and $1.1 million of MDOT programs. Congestion Mitigation Air Quality improvements provided $3.2 million directly and partially to Washtenaw County.
Map of Washtenaw County's Obligated Transportation Projects from FY 2013
Excellent Video from Ann Arbor Connector
/The Connector is a developing plan for high-capacity transit in an arc from northeast to south Ann Arbor, connecting major destinations including downtown, University of Michigan campuses and medical center, and commercial areas.
In the map below, the crescent-shaped region represents the area being studied for The Connector. (Click the map to view a larger image.)
Over the next 18 months The Connector project will be conducting an Alternatives Analysis, the results of which will be a choice between four different transit alternatives – bus, bus rapid transit, light rail transit, and automated guideway transit – that will determine the future course of project development. The study is managed as a collaborative effort of the AAATA, the City of Ann Arbor, the Ann Arbor Downtown Development Authority (DDA) and the University of Michigan (UM) and will also be closely coordinated with the Washtenaw Area Transportation Study (WATS), the Southeastern Michigan Council of Governments (SEMCOG), and the Michigan Department of Transportation (MDOT).


